Monitoring Navidrome
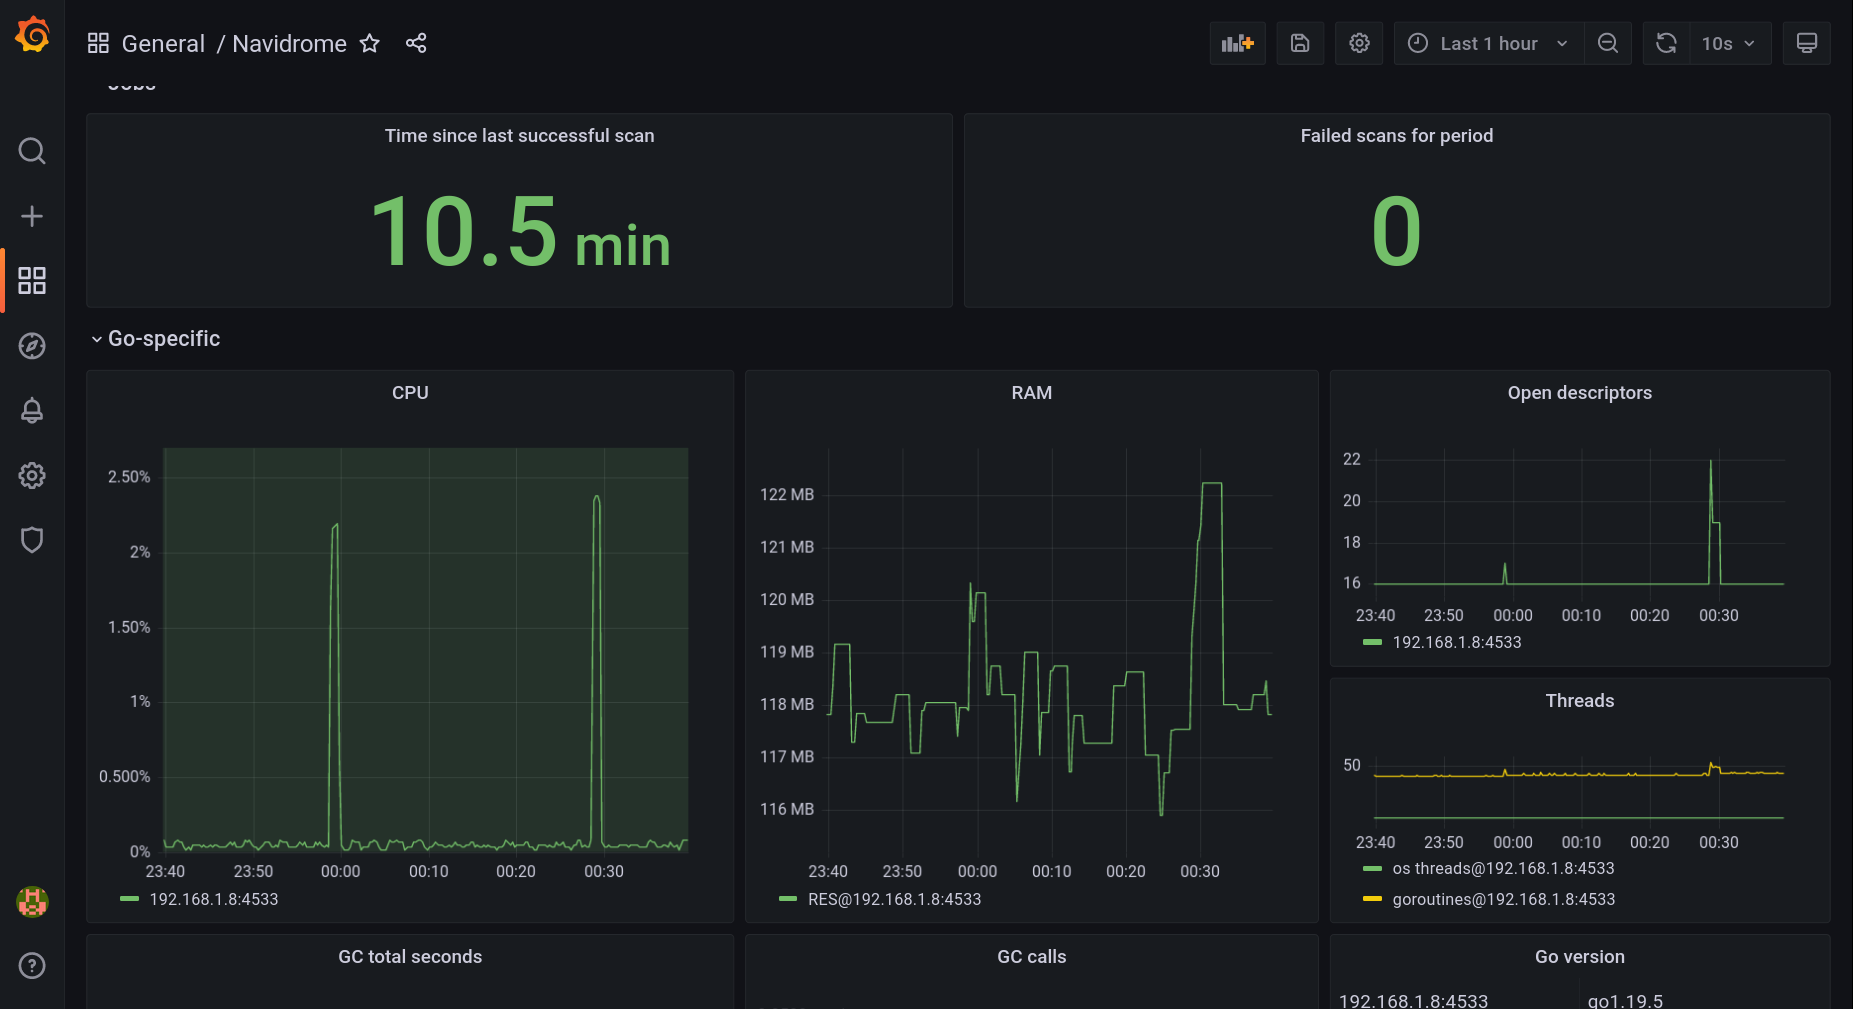
Currently, Navidrome supports monitoring and alerting using Prometheus/OpenMetrics standard. Example Grafana dashboard:
Overview
Prometheus is a service that takes data from a metrics endpoint and collects it. Grafana is a dashboard service that can take data from a Prometheus server and display it. Navidrome has an easy way to create a metrics endpoint that Prometheus can use. Once you point Prometheus to this endpoint, and Grafana to your Prometheus server, you will be able to monitor your Navidrome instance.
The easiest way to do this is using docker-compose and Docker networks.
Configuration
You need to set ND_PROMETHEUS_ENABLED to enable Prometheus metrics endpoint.
Setting custom ND_PROMETHEUS_METRICSPATH is highly recommended if your Navidrome
instance is publicly available.
Minimal docker compose example file with metrics enabled, and Prometheus and Grafana containers:
version: '3'
services:
  navidrome:
    image: deluan/navidrome
    user: 1000:1000 # should be owner of volumes
    ports:
      - "4533:4533"
    environment:
      ND_PROMETHEUS_ENABLED: "true"
      ND_PROMETHEUS_METRICSPATH: "/metrics_SOME_SECRET_KEY"
    volumes:
      - "./data:/data"
      - "./music:/music"
    networks:
      - metrics-network
  prometheus:
    image: prom/prometheus
    container_name: prometheus
    command:
      - '--config.file=/prometheus/prometheus.yml'
    ports:
      - 9090:9090
    restart: unless-stopped
    volumes:
      - ./etc/prometheus:/etc/prometheus
      - ./prometheus:/prometheus
    networks:
      - metrics-network
  grafana:
    image: grafana/grafana
    container_name: grafana
    ports:
      - 3000:3000
    restart: unless-stopped
    environment:
      - GF_SERVER_ROOT_URL=<your external grafana endpoint here>
      - GF_SERVER_SERVE_FROM_SUB_PATH=false # if your external grafana endpoint has a subpath or not
    volumes:
      - ./etc/grafana:/etc/grafana/provisioning/datasources
    networks:
      - metrics-network
networks:
  metrics-network:
    driver: bridge
Example prometheus.yml config to parse this instance:
global:
  scrape_interval: 10s
scrape_configs:
  - job_name: 'navidrome'
    metrics_path: /metrics_SOME_SECRET_KEY
    scheme: http
    static_configs:
      - targets: ['navidrome:4533']
Dashboard
Grafana dashboard available here: #18038.
Simple to install but fully fledged Grafana docker compose configuration can be found here.
Feedback
Was this page helpful?